This is a great visual. Interesting to see an objectively outstanding player like Benzema vary so wildly
Flash in the pan, or genuine sustainable scoring? How xG can help us sense check whether a striker’s run in front of goal is here to stay.

theanalyst.com
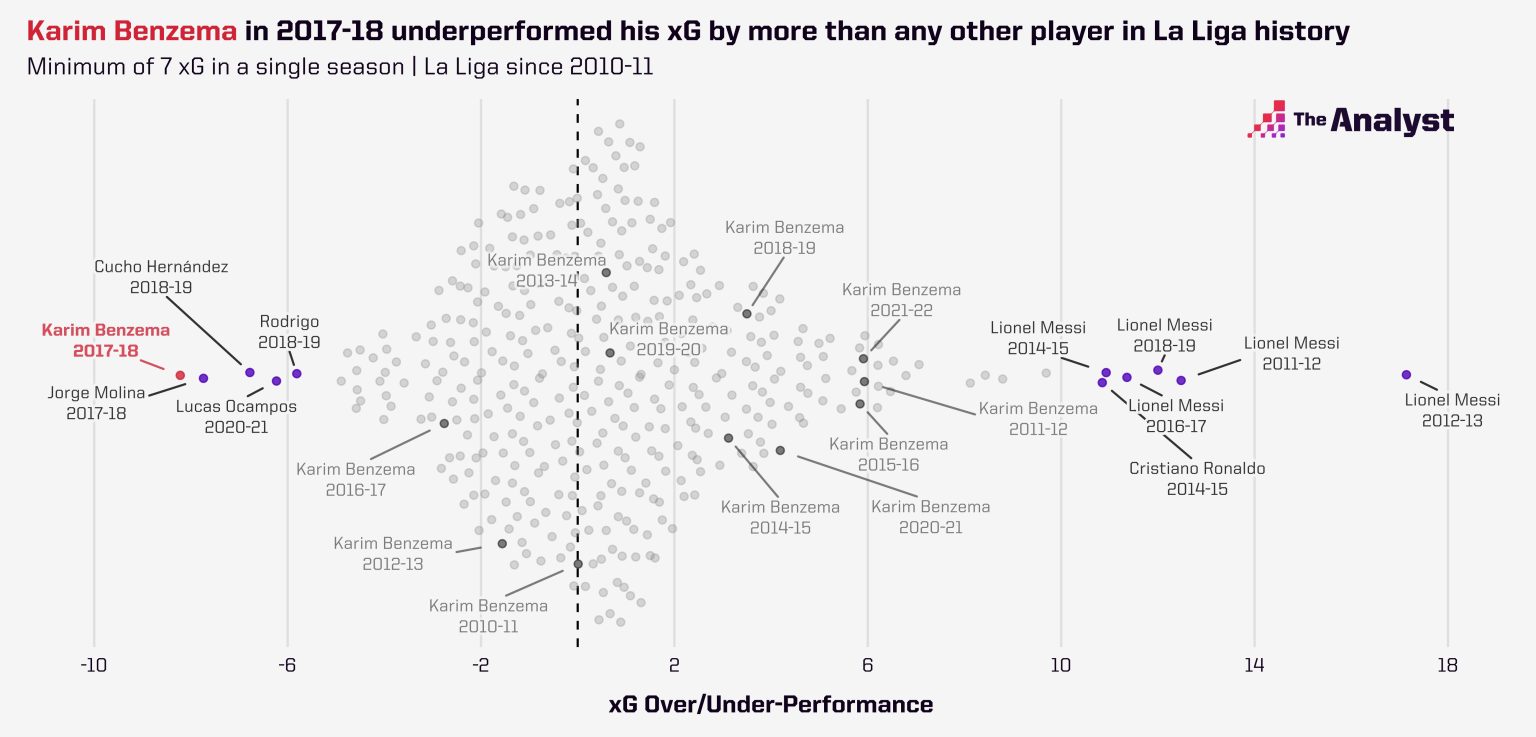
Karim Benzema, Real Madrid, 2017-18 | Goals (5), Expected Goals (13.2), Underperformance (-8.2)
It’s May 2018. You’re Real Madrid and you’ve relinquished your La Liga crown to rivals Barcelona. You finished third, 17 points off the winners, despite scoring 94 goals. You’re about to lose your all-time record scorer Cristiano Ronaldo, the man who scored 450 goals in 438 games, to Juventus and you’ve got [checks notes] a 30-year-old Karim Benzema to fill the void. The same Benzema who managed just five goals that season. *gulp*.
But again, look under the hood and expected goals tells us that Benzema should have scored over 13 goals that season. His underperformance of 8.2 is the biggest single underperformance of any player in La Liga in recorded history.
So, Ronaldo leaves. And what happens next? Benzema scores 20+ goals for three consecutive seasons, is currently on track for another 20 this season, and comes fourth in the 2021 Ballon d’Or rankings. Ok, so Real aren’t at the peak of their powers right now, but on an individual level, Benzema is perhaps in the form of his life. The Frenchman is renowned as a world-class finisher, and given that, his 2017-18 numbers were likely to positively regress.